Design/methodology/approach – The paper follows the DMAIC methodology to systematically
investigate the root cause of defects and provide a solution to reduce/eliminate them.
Six Sigma and DMAIC application – a case study
This section presents the practical application of Six Sigma, and DMAIC, in the rubber gloves manufacturing process of the organization studied.
Thus, this section is sub-divided based on the sequential stages that must be systematically undertaken, according to the DMAIC model, for process improvement and problem-solving.
In terms of the research methodology followed, a single detailed case study, like the one presented in this paper, can be considered a valid research approach to demonstrate the application of Six Sigma, DMAIC, and some of its concepts and tools so as to be replicated, or used as guide, by managers and engineers in their quest for the improvement of manufacturing processes.
Define
The first stage of the Six Sigma and DMAIC’s methodology is “define”. This stage aims at defining the
project’s scope and boundary, identifying the voice of the customer (i.e. customer requirements) and goals of the project .
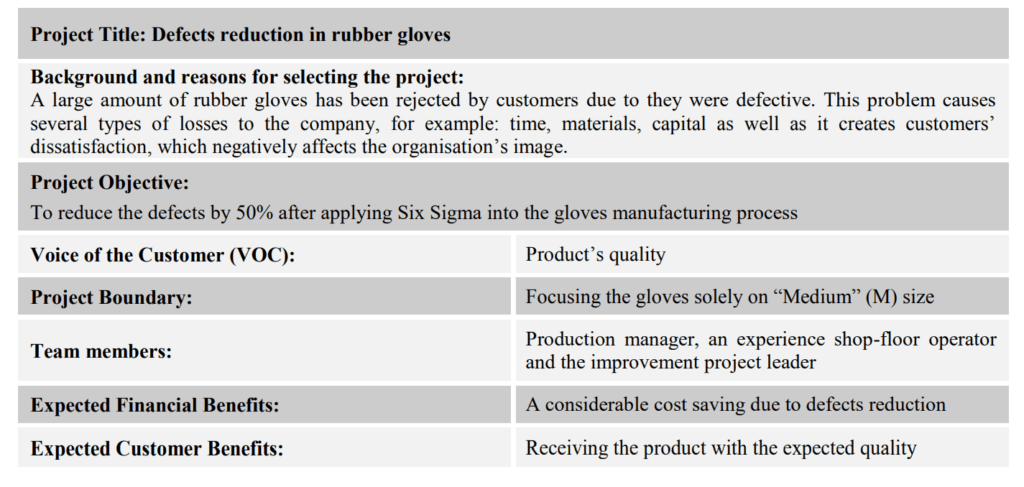
The problem selected to be tackled through this project was to reduce/eliminate quality defects (i.e. holes/stains) on gloves, which clearly comprise both an impact on customers’ expectations and important savings for the organisation studied.
Therefore, the voice of the customer (VOC) concept, which means identifying what the customers want and serving priorities to their needs was used in this project to define, based on customer requirements, the selected project’s objective.
In order to ensure that the research is in-control and focuses on the project problem explicitly, the boundary of the project had to also be defined and clearly indicated. This research was set to experiment solely with the gloves of “Medium” (M) size. The improvement team and organisation decided to initially focus on this particular product not only due to this size had historically had the highest number of rejected products but also the largest orders from customers.
The creation of the improvement team and definition of the project’s scope, boundary and objectives, gaining support from top management was a key activity.
The objective of this was to legitimate the improvement project, make the reduction of quality defects a goal for the organisation, and ensure that resources were assigned to it.
The concept of “cost of quality” was employed as a strategy to obtain top management’s commitment.
In this context, the overall cost that the organization was incurring on due to the production of
defective gloves was calculated.
Finally, a project charter, which is a tool used to document the objectives of the project and other parameters at the outset , was employed to state and present the project’s information structure.
The project charter, in other words, summarized the project’s scope, boundary, VOC, objective and the team’s role in this improvement project.
Measure
Particularly, in this project the “measure” phase meant the definition and selection of effective metrics in order to clarify the major defects which needed to be reduced . One of the metrics defined was simply number of defects per type.
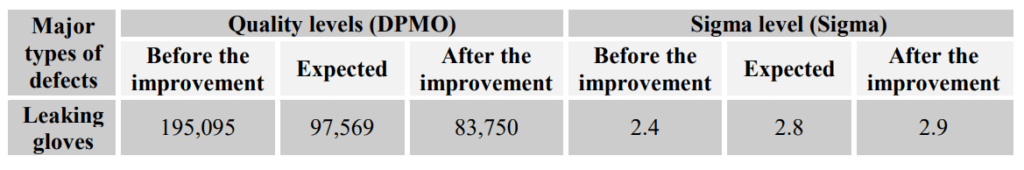
In addition, two other metrics were used to compare the “before and after” states of the gloves manufacturing process when conducting the Six Sigma’s project. These factors were quality level, which was measured through DPMO, and the Sigma level of the process.
After defining the total number of defects, the DPMO and Sigma level of the gloves manufacturing process were calculated.
According to the company’s records, there were two major types of defects which had contributed to the gloves to be rejected by the customers.
These two major defects were leaking and dirty gloves. In addition, other less frequent defects were grouped and categorized as “miscellaneous”.
For this particular research, the leak defect was defined as those gloves that had one or more holes and thus presented a water/air leak when subjected to quality testing. In the case of the dirty gloves defect, it was defined as the gloves not being clean (i.e. having one or more stain marks).
Finally, the miscellaneous category consisted of other types of defects such as misshaped, sticky gloves, etc. Defects data was collected for twenty days.

As a next step, a Pareto analysis was carried out to identify the utmost occurring defects and prioritise the most critical problem which was required to be tackled.
The collected data was generated in the form of a Pareto chart.

The Pareto chart indicated that the highest rate of defects was caused by leaking gloves. In particular, this type of defect contributed to over 60 percent of the overall amount of defects.
Therefore, the improvement team and organisation decided to initially focus on the reduction of the leaking gloves defect.
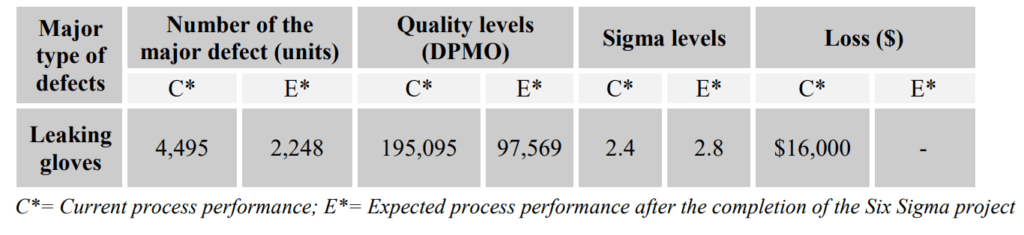
The leaking gloves defect rate was then translated into the quality and Sigma levels as “Quality level – 195,095 DPMO” and “Sigma level – 2.4 Sigma”.
With this amount of defects and Sigma level, and according to the classification of organisational performance the organisation studied could be categorised as “non-competitive”.
This reinforced the importance that this improvement project had for the organisation.
The calculation of the DPMO and Sigma metrics allowed the improvement team and organisation to have a more detail and operational definition of the current state of the gloves manufacturing process as well as the Six Sigma’s objective in terms of the gloves process improvement.
The next stage in the Six Sigma project, and following the DMAIC methodology, consisted in analysing the root causes of this particular problem, as well as identifying an appropriate solution.
Analyse
This phase in the DMAIC improvement model involves the analysis of the system, in this case the
manufacturing process that produces the rubber gloves, in order to identify ways to reduce the gap between the current performance and the desired objectives(s)
To do this, an analysis of the data is performed in this phase, followed by an investigation to determine and understand the root cause of the problem (defects).
The approaches and techniques normally used in the analysis stage include: process mapping, brainstorming, cause-and-effect diagrams, design of experiments (DOE), hypothesis testing,
statistical process control (SPC) charts and simulation .
In order to gain an enhanced comprehension and understanding of the gloves production process, which is a main requirement for improvement, the analysis phase of this project started from illustrating the manufacturing process using a flowchart.
Flowchart is a basic graphical tool used for displaying processes’ flow sequentially in order to gain a full comprehension and understanding of the process.
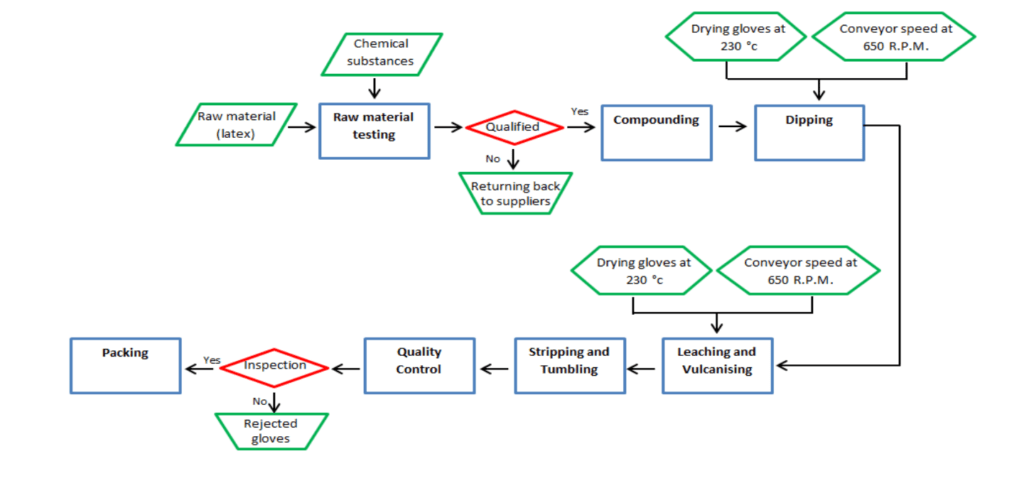
Once that the inputs, outputs and sequence of the process were understood with the help of the flowchart, an analysis was carried out to identify the root cause(s) of the leaking gloves quality defect.
Several brainstorming sessions were conducted to identify, based on the improvement team members’ experience, possible causes as to why the leaking problem in gloves occurred.
In order to illustrate and categorised the possible causes of the problem, a cause-and-effect
diagram was constructed.
The cause-and-effect diagram or fishbone diagram, is a systematic questioning technique for seeking root causes of problems by providing a relationship between an effect and all possible causes of such effect .
Once completed, the diagram helps to uncover the root causes and provide ideas for further improvement.
There are five main categories normally used in a cause-and-effect diagram, namely: machinery,
manpower, method, material and measurement (5M) plus an additional parameter:
environment.
The possible root causes brainstormed are illustrated in the cause-and-effect diagram shown in.
After considering all possibilities, it was found that some stages and operations (i.e. dipping, leaching and vulcanising) within the gloves manufacturing process had an impact on causing the leaking gloves.
In particular, it was determined that two process factors (i.e. oven’s temperature and conveyor’s speed) had a direct effect on the number of leaking gloves produced.
Interestingly, these parameters had a relationship between each other as the gloves have to be dried by using oven’s heat at the same time as they are conveyed by the rollers.
As a consequence, the relationship between oven’s temperature and conveyor’s speed and their impact on the number of leaking gloves produced was investigated in the following DMAIC’s improve phase.

Improve
After the root cause(s) has/have been determined, the DMAIC’s improve stage aims at identifying solutions to reduce and tackle them .
Therefore, although experience and common sense dictated the existence of a correlation between oven’s temperature and conveyor’s speed with the number of leaking gloves, the DOE technique was used to investigate whether the assumed correlation was statistically significant.
In particular, an experiment was designed to investigate whether the combination of the factors oven’s temperature and conveyor’s speed had a negative effect on the process, causing leaking gloves.
Specifically, the experiment consisted in manipulating these factors by modifying them into different parameters (i.e. other values for oven’s temperature and conveyor’s speed) and analysing their impact on the process output.
The two factors which were mentioned earlier (i.e. oven’s temperature and conveyor’s speed) were investigated with four different parameters of temperatures; 220°c, 225°c, 230°c and 235°c and four distinct speeds; 600, 650, 700 and 750 revolutions per minute (RPM).
The experiment was conducted with two factors (i.e. temperature and speed) at four levels each.

For example, at an oven’s temperature of 220°c and a conveyor’s speed of 600 R.P.M., 278 leaking gloves (out of the 1,280 units inspected) were found in replication one, whereas in replication two, 244 leaking gloves were identified, and so on.
As the statistical test aimed at investigating whether the two factors (i.e. oven’s temperature and conveyor’s speed) resulted in defective gloves, null and alternative hypotheses that suggested whether a variation in the number of defects would occur if the oven’s temperature and conveyor’s speed were varied were formulated.
These hypotheses are presented below.
H0 α: There is no interaction between the temperature and the number of defects (leaking) (α220°c = α225°c = α230°c = α235°c)
H0 β: There is no interaction between the speed and the number of defects (leaking) (β600 = β 650 = β 700 = β 750)
H1: There is interaction between the temperature and speed
Note: αi = variance derived from the temperature
βj = variance derived from the conveyors speed
Once formulated, the hypotheses were tested through the two-way ANOVA analysis with replication shown below.

Hypotheses are evaluated based on the P-value and the F statistic values .
In case of the F statistic, Devore and Peck (1993) cite that when F value is higher than F critical, H0 is rejected.
On the other hand, the P-value represents the null hypothesis’s rejection when the P-Value is less than a significance value. In the case of this improvement project, a comparison of F and F critical was used to test the hypotheses.
This resulted in H0 α to be rejected (Fα = 16.73373 > Fα critical 2.798061), H0 β to be rejected
(Fβ = 18.77653 > Fβ critical = 2.798061), and H0 to be rejected (Fαβ = 21.47981 > Fαβ critical = 2.08173).
Therefore, the two-way ANOVA analysis indicated that there was a correlation between the oven’s temperature and conveyor’s speed at a significance level = 0.05 .
As a result, the analysis helped to statistically conclude that both temperature and speed influenced the amount of leaking gloves.
After it was statistically proven that the temperature and speed had a correlation with the number of leaking gloves, the next step was to determine the optimum temperature and speed that would result in the lowest amount of defects.
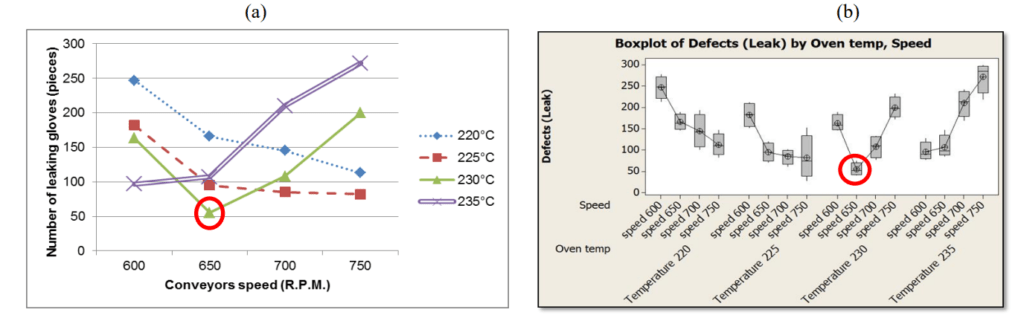
The number of defects from the experiment replications are summarised in the line and Boxplot charts presented in Figures 4(a) and 4(b).
These figures denoted that a 230°C temperature and conveyor speed of 650 R.P.M. provided the lowest amount of leaking gloves.
Number of leaking gloves defects correlation with oven’s temperature and conveyor’s speed –
(a) line chart and
(b) Boxplot chart representations
After the optimum parameters were defined, a trial was performed in order to test whether the optimum
parameters (i.e. 230°C and 650 R.P.M) defined by the experiment were the best options to provide an
improvement for the gloves manufacturing process and reduce defects.
The results indicate that the optimum parameters identified in the experiment improved the gloves manufacturing process by reducing the amount of leaking gloves by about 50 percent.
This resulted in a reduction of DPMO from 195,095 to 83,750 and a Sigma level improvement from 2.4 to 2.9.
Consequently, the initial targets set for DPMO and Sigma level, were exceeded.

It can be concluded that, by setting up the oven’s temperate at 230°c and conveyor’s speed at 650 R.P.M., not only did the amount of leaking gloves defect declined but also the other types of defects.
Control
The aim of the control phase is to sustain the gains from processes which have been improved by institutionalizing process or product improvements and controlling ongoing operations .
Design controls can then be used to monitor the processes and ensure that the improved processes have remained in-control .
In the case of this improvement project, the organisation studied institutionalized the improvements made by including the optimum parameters for the oven’s temperature and conveyor’s speed in the process sheets used during the calibration of the oven and conveyor.
In addition, control charts were also implemented to detect abnormalities in the process so appropriate actions can then be taken to eliminate them.
Control charts are a statistical tool for monitoring a process to identify whether there are special causes of variation affecting it.
Control charts are commonly used in the control phase of DMAIC. In particular, p and np charts were implemented to monitor the performance of the rubber gloves production process.
This has allowed the organization studied to sustain the improvements achieved.

Final results summary